

New
Year-End Medical Billing: Why Temp Staff Won’t Stop 2027 Denials
Read this before you hire a temp agency for your year-end medical billing crunch. Claimocity has a better way to handle the billing crunch and your year-round RCM services.
How to interpret your score and know how to improve
A MIPS score can look fine on paper and still leave money on the table.
You probably know your MIPS score from last year. You might even remember whether it triggered a payment adjustment. But do you know if that score was actually good, or just good enough to avoid penalties? There’s a difference, and that difference is worth real money.
The 75-point performance threshold gets all the attention because it’s the line between penalties and bonuses. Cross it, and you’re safe. But safe and optimized are two different things. A practice scoring 76 points avoids penalties and earns a modest bonus. For some practices, that may be as good as it gets. For other practices, small changes can push that score into the 80s or 90s, which earns a slightly larger adjustment and a much bigger cushion against a bad year.
MIPS scoring is relative. What you count as good depends on your financial goals, your patient population, and how much effort you’re willing to invest in improvement. The providers who score highest tend to capture measure data as they document, so there’s no end-of-year scramble. If you’re still learning the basics, check out our complete guide to MIPS reporting.
In MIPS, “good” isn’t a fixed number. It depends on context.
The program is built around benchmarks, redistribution, and relative performance. That means the same score can carry different implications depending on how others perform, how categories are weighted that year, and how close you are to key thresholds. Clearing the line once doesn’t guarantee the same outcome next year.
Before deciding whether a score is good, it helps to understand what that number actually represents and how much room for error it leaves.
You can check out our guide to How MIPS Scoring Works, but basically your score comes from four performance categories, each weighted differently:
Quality (30%): You select and report on six measures relevant to your specialty. CMS benchmarks your performance against national data and awards points based on where you fall.
Cost (30%): CMS calculates this automatically from your claims data. They evaluate the total cost of care for your patients compared to peers treating similar populations.
Promoting Interoperability (25%): This measures how well you use certified EHR technology through attestations and performance thresholds for things like e-prescribing and patient portal access.
Improvement Activities (15%): You attest to completing two approved activities, or one if you’re a small, rural, HPSA, or non-patient-facing clinician or report through an MVP, for at least 90 consecutive days.
That said, these performance categories often work a little differently for hospitalists. That’s because hospitalists don’t control the hospital’s EHR, so CMS usually reweights Promoting Interoperability (PI) to 0%. Quality then counts for 55% of the final score.
Each category has different reporting requirements. Quality and Promoting Interoperability require data submission. Cost is calculated for you. Improvement Activities rely on attestation. Your performance in all four gets weighted and combined into a final score between 0 and 100.
“Good” is relative when it comes to MIPS scores. For some practices, 76 points feels like a win because they avoided penalties. For others, anything below 90 points signals underperformance. Your target score should align with your financial goals and how much time you can realistically dedicate to quality reporting.
Think about it this way: 75 points keeps you neutral. You’re not losing money, but you’re not earning a bonus either. Every point above 75 adds a little to your positive adjustment, and the highest scores earn the most. There’s no separate bonus tier at 90 anymore, so the extra revenue from a higher score is real but modest.
Most providers aim for the minimum threshold and call it done. That approach makes sense if you’re short on resources or administrative support. But if you’re already scoring 80 to 85 points, reaching 90 isn’t as steep as you might think, and it gives you room to absorb a bad measure year. Small targeted improvements in one or two categories can be enough to move into a stronger position without overhauling your entire workflow.
One number decides which way your Medicare payments move: 75 points. Below it, CMS cuts your Medicare Part B payments. Above it, you earn a positive adjustment. The two sides aren’t the same size, and that difference should shape your target score. In fact, many practices look to earn extra points as a buffer against unexpected penalties more so than the modest reimbursement bonus.
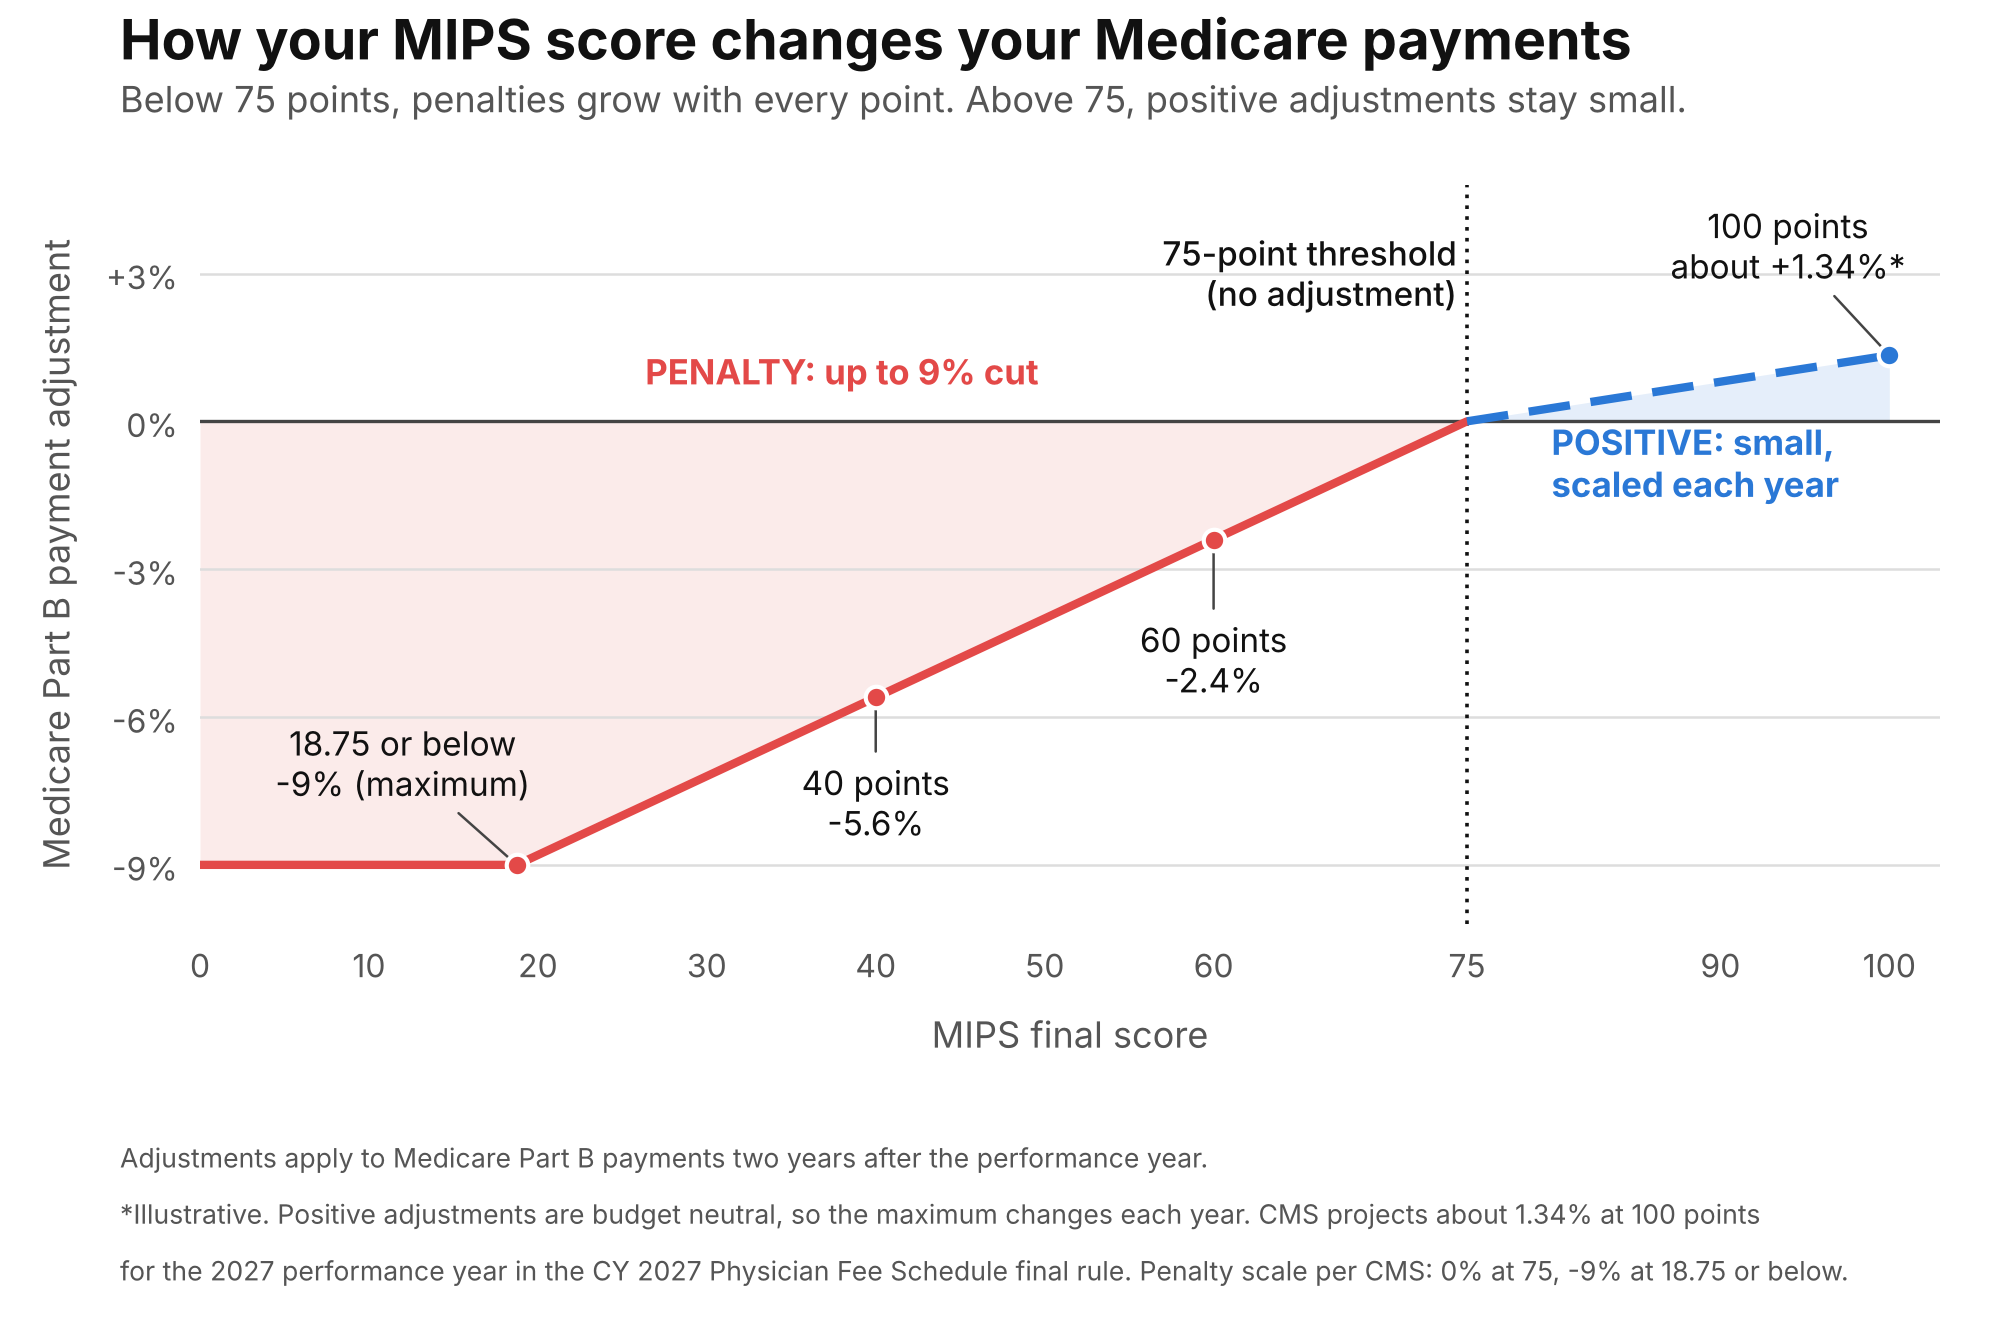
A score below 75 triggers a negative payment adjustment on a sliding scale. At 75 points there’s no adjustment. Each point below 75 adds about 0.16% to the cut, until the penalty hits its 9% maximum at 18.75 points or below.
Here’s what that looks like for a hospitalist group billing $800,000 a year in Medicare Part B:
| Final score | Payment adjustment | Annual impact on $800,000 |
|---|---|---|
| 75 | 0% | $0 |
| 70 | -0.8% | -$6,400 |
| 60 | -2.4% | -$19,200 |
| 50 | -4.0% | -$32,000 |
| 40 | -5.6% | -$44,800 |
| 18.75 or below | -9.0% | -$72,000 |
If you’re required to participate and don’t submit any data, you’ll usually end up with a score of zero and the full 9% cut.
Every score above 75 earns a positive adjustment on a sliding scale, and the highest scores earn the most. There’s no separate bonus tier at 90 or 95. CMS ended its extra bonus for exceptional performers after the 2022 performance year.
The positive side is small because MIPS is budget neutral. Bonuses are funded by the penalties collected from clinicians who score below 75. Most clinicians clear the threshold, so that pool gets spread thin. For the 2027 performance year, CMS projects the maximum positive adjustment at about 1.34%, and that’s for a perfect score of 100.
The penalty side is steep and the bonus side is shallow. A practice at 76 and a practice at 91 both avoid the cut, and the gap between their bonuses is modest. The bigger payoff of a higher score is the buffer it gives you. If benchmarks tighten, a measure gets removed, or data completeness slips, a practice at 91 can absorb the hit. A practice at 76 can drop below the line, and every point below 75 costs real revenue.
MIPS does not score providers in isolation. Every performance year, CMS looks at how clinicians perform as a group and uses that data to set benchmarks and distribute adjustments.
When you compare your score to national performance ranges, you can see whether you’re clustered near the middle or performing well above it. Practices near the average often have a limited margin if benchmarks tighten or attribution shifts.
Access your score through the Quality Payment Program portal. You’ll find your total score, category performance, and historical data. CMS feedback reports show how you compare to other clinicians reporting the same measures.
Your reporting type affects what you see. Individual reporting means your own score. Group reporting reflects the entire practice, which creates poor comparisons across different specialties. This is one of the reasons specialty care is increasingly moving to the MVP reporting model with subgroup reporting. That way, hospitalists don’t get averaged with primary care.
Compare your score to published national data. CMS projects a median final score of about 89 for the 2027 performance year. Scoring 81 when the median is 89 means you’re below the middle of the pack despite avoiding penalties.
The CY 2027 final rule doesn’t move the target. The performance threshold stays at 75 points, and the payment scale works the same way it does today.
CMS’s projections for the 2027 performance year show where most clinicians will land:
| Projection for the 2027 performance year | CMS estimate |
|---|---|
| Median final score | About 89 |
| Clinicians receiving a positive adjustment | About 88% |
| Clinicians receiving a negative adjustment | About 7.6% |
| Largest positive adjustment | About 1.34% |
Two changes affect how you get there. First, most clinicians now have to report at least one MIPS core measure in Quality. Small practices are exempt. If one applies to you and you skip it without attesting that none applies, one of your six measures scores zero. Second, CMS removed the Security Risk Analysis measure from Promoting Interoperability and added an optional electronic prior authorization measure worth bonus points. That second change only matters if you report PI, and most hospital-based clinicians don’t.
The bigger change is outside MIPS. Medicare’s physician conversion factor drops 2.31% in 2027. For hospitalists, that works out to about 2.3% to 4.1% less per visit on core inpatient codes. MIPS adjustments are a percentage of those lower payments. A penalty now cuts deeper into a smaller check, and a positive adjustment of around 1% is a small offset. Either way, staying above 75 matters more than chasing a few extra points of bonus.
For the full list of updates, see what’s changing in MIPS for 2027.
Once you’re clearing the performance threshold, improvement is usually about tightening execution, not doing more work.
Quality is often the easiest place to gain points. Practices tend to lose ground not because care is missing, but because documentation doesn’t match the measure requirements. Reviewing measure definitions, denominator logic, and exclusion criteria can uncover points you’re already earning but not capturing consistently.
Promoting Interoperability is less flexible, but also predictable. Missed points here usually come from incomplete attestations, timing issues around patient access, or required attestations that weren’t fully documented. A mid-year check can prevent surprises at submission.
Improvement Activities tend to be underutilized. Many practices already meet the requirements through care coordination, quality committees, or safety initiatives. The difference is documenting those activities clearly and for the full reporting period.
Cost is harder to control directly, but understanding attribution helps. Knowing which episodes and patients are feeding into cost measures allows practices to anticipate where scores may be vulnerable and avoid preventable point loss.
Higher MIPS scores come down to better data tracking. You need to know where you are earning points and where you might be missing some before the reporting year ends. Again, hospitalists are a great example. By confirming early on that your Promoting Interoperability (PI) will be reweighted to 0%, you can put more resources to maxing out your Quality score.
Claimocity integrates MIPS tracking into your existing workflows. Quality measures, documentation, and reporting happen where you’re already working. We make it easier for inpatient providers to understand how their score is calculated and where small adjustments can have the most impact.
MIPS-related information is recorded as part of everyday encounters, so there’s less reliance on chart reviews or end-of-year cleanup.
Care coordination efforts, safety initiatives, and quality programs are documented along the way, making attestation simpler and more reliable.
Reporting views help teams see which areas are on track and which may need attention before submission deadlines.
Claimocity works with Patient360 to send required data without manual uploads or file exports.
Everything runs through one single platform, from charge capture to MIPS tracking, so you don’t have to manage multiple systems or duplicate data.
Higher MIPS scores mean bigger payments, but getting there usually means more administrative work. Claimocity changes the equation so you can improve your score without the burden. We do the heavy lifting, you get more time and more money. Ready to feel the difference?
Read this before you hire a temp agency for your year-end medical billing crunch. Claimocity has a better way to handle the billing crunch and your year-round RCM services.

Palliative care is growing despite challenges to make these services as profitable as hospice care. Learn how to close the gap with better billing.

From cardiologists who provide critical care to rheumatology consultations, know how CPT codes are used for inpatient care in 2026 and 2027.
Ease your provider experience with us.